Pattern Recognition (Ch 6)
Nearest Neighbor
Nearest Single Neighbor
A nearest neighbor coloring tries to mark each uncolored square with the sample that is closest to it. We will count diagonal squares as 1.5 distance. When there is a tie for nearest neighbor between two colors, leave the square blank. The example below walks through the process.
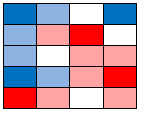
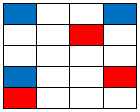
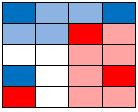
Starting, off we know the value of these 6 squares: |

|
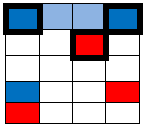
Anything right next to only one known cell is easy - distance of 1 can’t be beat (remember diagonal is distance 1.5): |
|
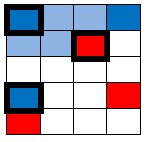
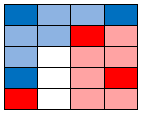
The two white squares in the upper right are 1 away from both red and blue. They are a tie. Now let us look at the other two squares. The middle left white square is 1.5 away from blue and from red (diagonal). That is a tie, so it stays white: |
|
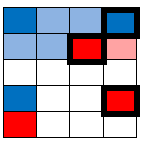
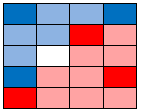
Now the lower right white square. It is 1.5 away from a red and 2.5 away from a blue (sideways = 1, diagonal = 1.5). Red wins, giving us the final coloring shown below. |
|
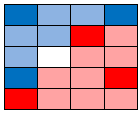
Final nearest neighbor coloring. Pink/Blue show squares we can make an educated guess about. White ones we are too unsure about to guess at. |
|
Nearest 3 Neighbors
Nearest three neighbors is the same idea, but we look at the closest three known values to color each cell. If 2 of the closest known ones are one color and 1 is the other, we chose the color that has 2 “votes”. This prevents say one red square in a sea of blue from having much influence.
Starting from the same known squares: |
|
The two in the top row are closest to the 2 blue and one red square… they all become blue: |
|
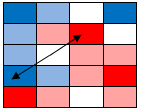
These next two cells have these three as “nearest three neighbors: |
|
This next cell is pink. It is closest to 2 red and 1 blue: |
|
These all become pink as well. Each is pretty easy to determine visually: |
|
Now the square above the bottom blue. It is 1 away from the blue below it, 2 away from the blue above it, 2 away from the red below it and 2.5 away from the red above and to the right. 2 blues and one red are closest, so it is blue: |
|
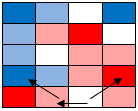
Those bottom two are closest to the two bottom reds and the one bottom blue… they must be pink: |
|
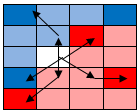
Finally, the last square. It is 1.5 from both a red and a blue (the diagonal neighbors). It is 2.5 away from the upper left blue and lower left red and lower right red. We have a tie for 3rd closest value and the first two closest were split. We will call this a tie. (We could take votes for the most common 3rd closest color, but we will not complicate things by doing so). |
|
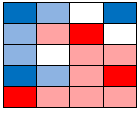
The final result with 3-nearest neighbors. |
|