Valgrind
A Walkthrough
The video below demonstrates using the CS Student server to debug memory issues using Valgrind.
Leaks on Mac - If you are using Leaks on a Mac, the process will be the same as is shown in this video, you will just type slightly different commands. Start by watching this video to get a sense for what you are looking for using Leaks, then refer to the Leaks page in this guide for the Leaks syntax.
Building Code
This command will build all of your .cpp files into the program MyProgram.exe and place it in the linux folder. You will only be able to run it from the guest OS. If there are compile errors, stop and fix them (you can edit files in your host OS):
g++ -g -o program.exe *.cpp
Compile (g++) with debugging information (-g), call the program MyProgram.exe (-o MyProgram.exe), using all the .cpp files in this directory (.cpp)*
Make sure to include the debugging info flag (-g). If you do not, you will not get line numbers in the error reporting, which will make them much less useful.
If you do not want to compile all the .cpp files (because you have say a test file and a main.cpp and do not want to include them both), list them out instead of using *.cpp:
g++ -g -o program.exe main.cpp other1.cpp other2.cpp ...
make.When you build your program in Windows, you create an executable that is only designed to run in Windows. When you build you program in Linux, you create a program that is only designed to run in Linux.
If you program refuses to run, you might be running the wrong version!!! Try deleting program.exe
and recompiling the code on the platform you are trying to run it on.
Running Code
To run the program do:
./program.exe
Run program.exe that is in this folder (./)
Your program should run and show you the output. The working directory is the current folder, so any data files your program needs to read should be in that folder.
Running With Valgrind
To use valgrind on your program, run valgrind and tell it to run your program.
valgrind ./program.exe
If there are memory errors, it will spit out a report like the following:
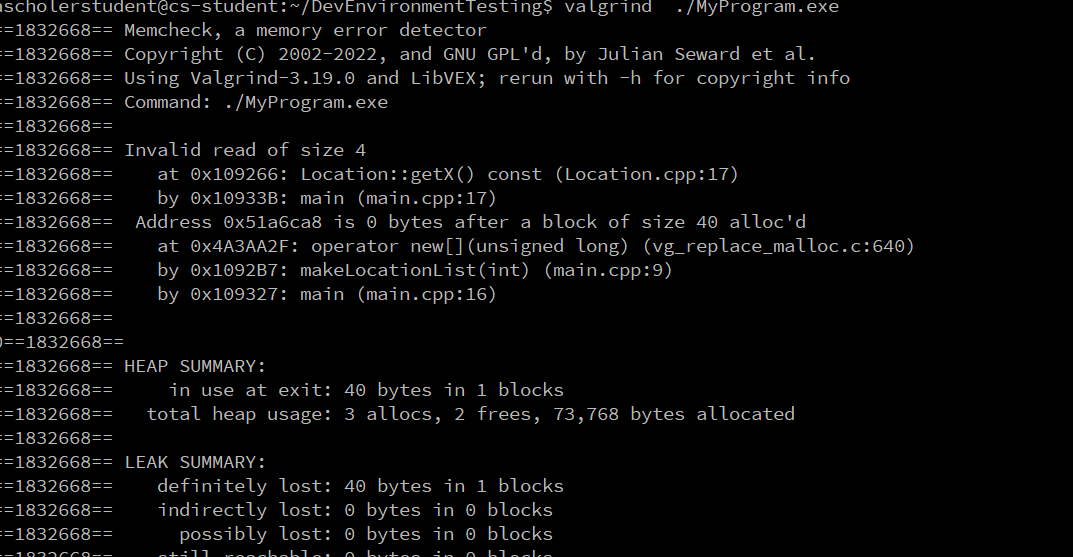
The report is likely quite long, scroll back up to the top and worry just about the first error. (One memory issue can cause a cascade of other, possibly phantom issues. Fix one issue at a time, starting from the first one encountered.)
Reading the Report
The first (and only) error in the report above says Invalid read of size 4.
It then shows a stack trace that tells me where it happened:
at 0x... Location::getX() const (Location.cpp:17)This is where we detected something bad. Line 17 of Location.cpp in the getX() function.by 0x... main (main.cpp:9)It was called by the main function on line 9 of main.cpp.
Below that it tells me that the memory is right after memory that was allocated in. We'll look at it later.
I want to start at the top of the list and check each level until I find a potential issue. So I will start with Location::getX. Here is the code:
int Location::getX() const {
    return x;                       //line 17
}
The only way that will cause an error is if x is invalid. It does not look like the source of the error, just the symptom. So I need to check out where we called that from. The main function, line 9:
...
int main()
{
    //Get an array of 5 locations
    Location* locationList = makeLocationList(5);
    cout << locationList[5].getX();                 //line 9
}
Line 9 accesses index 5 of locationList and calls getX on it. That could go bad if there is no index 5 in the array, or if the array was never initialized with valid Location objects. In this case, I can see from the comment and previous line that I made an array of 5 Locations, so there is no index 5 - the highest index I should be accessing is 4.
The part that starts Address 0x... is 0 bytes after a block of size 40 alloc'd...
is trying to help me by pointing out that the memory I am accessing is right after some
memory that would make sense to use. Here is where that memory comes from:
at 0x... operator new[] ... (vg_replace_malloc.c:640Some valgrind magic... not my problemby 0x... makeLocationList(int) (main.cpp:9)On line 9 of main.cpp, inside makeLocationList, is where I called new.by 0x... main (main.cpp:16)Is where on line 16 of main.cpp, in the main function, I called makeLocationList.
That is showing me that there is an array that I allocated in makeLocationList that I am 0 bytes past the end of... I just barely walked off of that array. That is a clear hint that I must have used an index that is 1 too big.
Reading the Report - Using Freed Memory
Examine this code:
Location* makeLocationList() {
  Location* locationList = new Location[5];
  delete [] locationList;               //line 10
  return locationList;
}

int main() {
  Location* locationList = makeLocationList();
  cout << locationList[4].getX();               //line 16
}
Notice that the function makes an array, deletes it, then returns the now invalid pointer. Main tries to use that memory and then tries to delete it again. Here is what valgrind says:
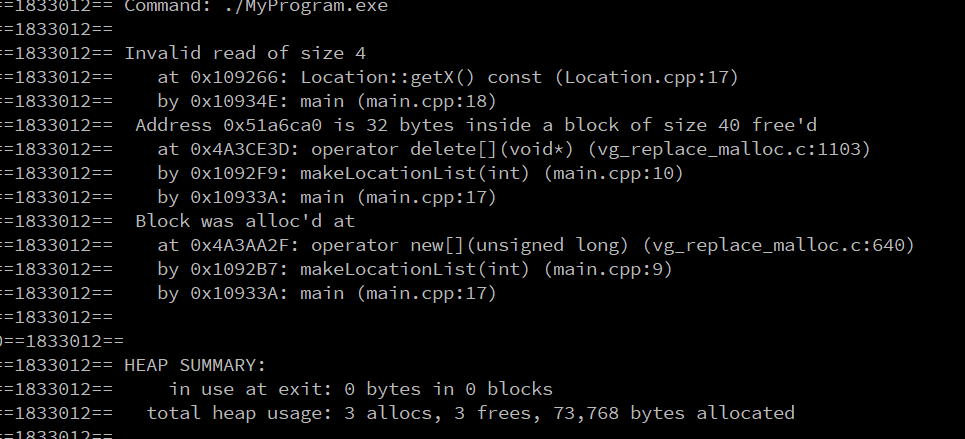
Again, I can see that we encountered an issue in getX at line 17 of Location.cpp. But that does not seem to be the root of the problem. It was called from line 18 of main.cpp where I access an array... that seems much more like a spot something might have gone wrong.
Below that I am told that Address 0x... is 32 bytes inside a block of size 40 free'd:
at 0x... operator delete[] ... vg_replace_malloc.c:1103This is part of valgrind.by 0x... makeLocationList(int) (main.cpp:10)I called delete from line 10 inside makeLocationList. This is where I deleted the memory.
Valgrind can't tell me how to fix the issue. I need to delete the memory later, after I am done using it, or be more careful not to use the memory after deleting it. (In this case I do not want to delete the array I just created in makeLocationList, I want to return it and let the caller delete it when they are done with the array.)
Reading the Report - Leaks
Now I have removed the delete line. I run the program and get:
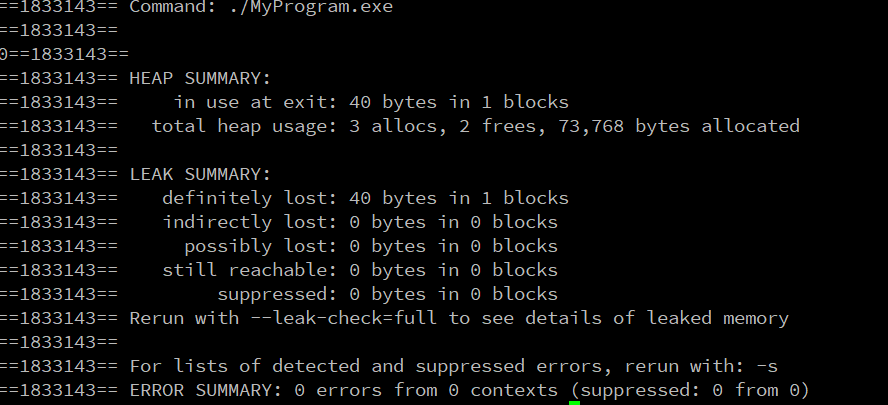
I am told that I definately lost: 40 bytes in 1 block. That means there was one new allocation
that had 40 bytes that I leaked. At the bottom, it says Rerun with --leak-check=full to see details. So let's do that:
valgrind --leak-check=full ./MyProgram.exe
Here is what I get:
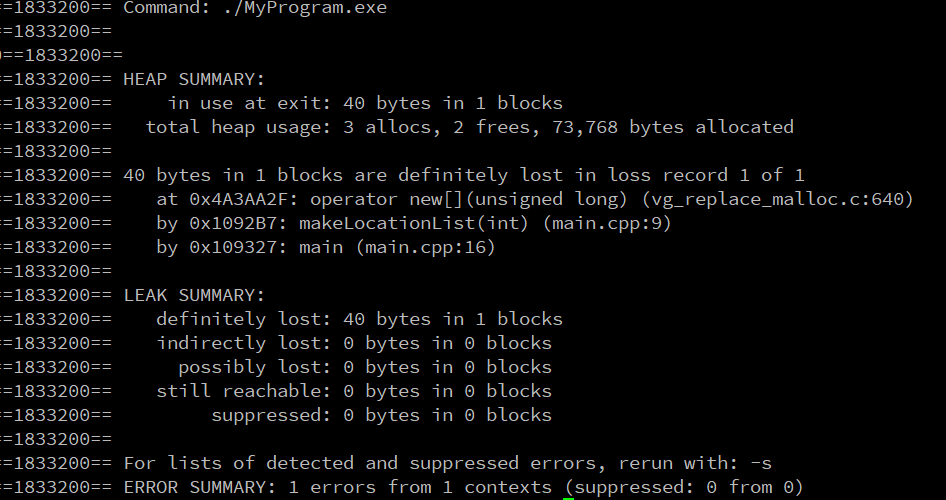
Now it shows that the 40 byte I lost were:
at 0x... operator new[] ... (vg_replace_malloc.c:640Some valgrind magic... not my problemby 0x... makeLocationList(int) (main.cpp:9)On line 9 of main.cpp, inside makeLocationList, is where I called new.by 0x... main (main.cpp:16)Is where on line 16 of main.cpp, in the main function, I called makeLocationList.
DrMemory showed us where the memory that was leaked was created. It can't tell us where we should have deleted the memory - figuring that out is our job. We need to decide when we actually are done with that memory and add delete it at that point. In this case, I am not done with the memory until the end of main. I could fix the leak by deleting the memory there:
int main() {
  Location* locationList = makeLocationList();
  cout << locationList[4].getX();               //line 16
  delete [] locationList;
}